Node debugging
Recently I spent some time debugging Node while doing Advent of Code 2016.
Two things made my life easier, which I did not use before:
- Using Chrome inspector.
Sometimes you need to go deeper than spraying console.log all over the code.
Since version 6.3.0 you can run node --inspect --debug-brk script.js and get full Chrome debugging experience for your Node process out of the box.
Minor inconvenience is that Chrome does not open automatically, you need to copy/paste the link every time. I solved this by installing inspect-process and adding an alias:
alias node-debug='inspect --debug-brk'- Using
Restart frame.
Before, I always restarted the whole script to run through the particular part again. But losing state is inconvenient.
Everything changed when I finally found "Restart frame". This action will restore state at the start of the selected call stack item.
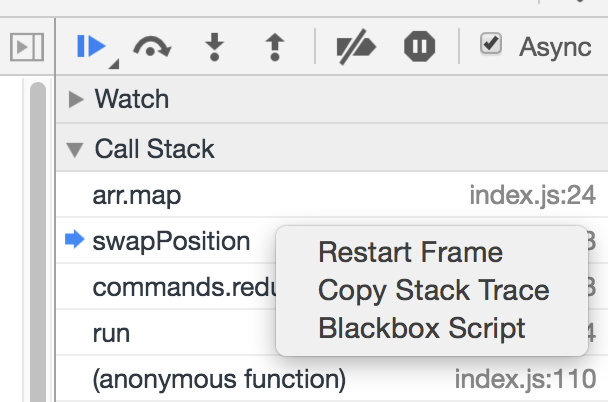
Right click stack item